
Finnase is an advanced financial dashboard application that leverages data visualization and machine learning to provide businesses with deep insights and predictive analytics.
Key Features:
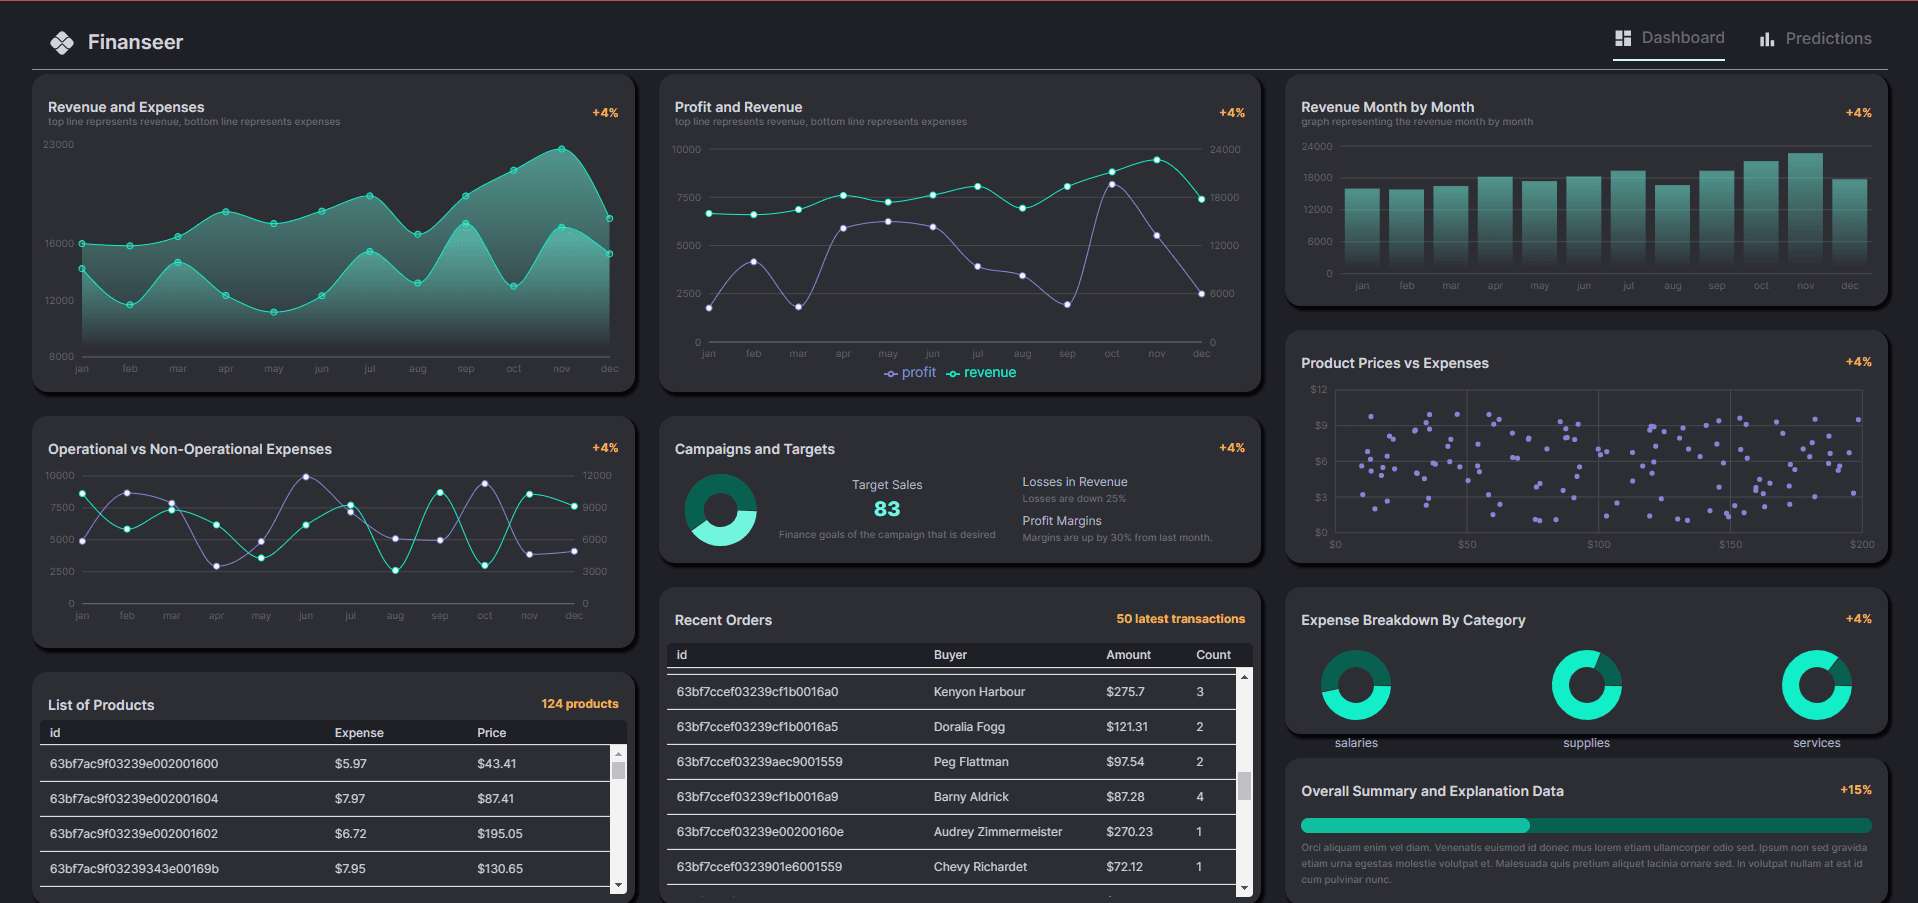
Interactive charts and graphs for financial data visualization
Machine learning-powered predictive analytics
Custom report generation
Real-time data updates
Integration with various financial data sources
Technology Stack:
Frontend: React.js with D3.js for data visualization
Backend: Node.js with Express.js
Database: MongoDB for flexible data storage
Machine Learning: Python with scikit-learn and TensorFlow
Authentication: OAuth 2.0
API Integration: RESTful APIs for data source connections
The development of Finnase was driven by the need for a comprehensive tool that could not only visualize financial data but also provide predictive insights.
The frontend was developed using React.js, with a focus on creating a responsive and intuitive user interface. recharts was integrated for its powerful data visualization capabilities, allowing for the creation of complex, interactive charts and graphs. This required a deep dive into data visualization best practices to ensure that the presented information was both accurate and easily interpretable.
The backend architecture was designed to handle large volumes of financial data efficiently. Node.js and Express.js were used to create a scalable server that could process requests quickly. MongoDB was chosen as the database for its ability to handle varied and evolving data structures, which is crucial for storing diverse financial information.
Redux Query was used to seamlessly manage API requests, caching, and data synchronization between the client and server. Implementing Redux Query required a deep dive into its ecosystem and best practices. It involved refactoring existing API calls, setting up efficient caching strategies, and carefully designing the application's state shape to fully leverage Redux Query's capabilities. The result was a more robust, performant, and maintainable codebase that could handle complex data requirements with ease.
Throughout the development process, there was a strong focus on performance optimization. This included implementing efficient data caching strategies, optimizing database queries, and ensuring that the application could handle real-time updates without compromising on speed or reliability.
The result is a powerful financial dashboard that not only presents data in an accessible format but also provides valuable predictive insights, demonstrating the ability to combine complex backend logic with intuitive frontend design and cutting-edge machine learning capabilities.